Elements
左边是 DOM 元素, 右边是对应的 CSS。
颜色
切换颜色格式
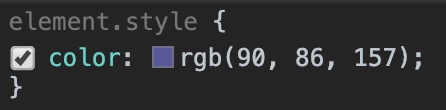
按住 shift 键点击颜色框可以切换颜色的不同格式
调色板
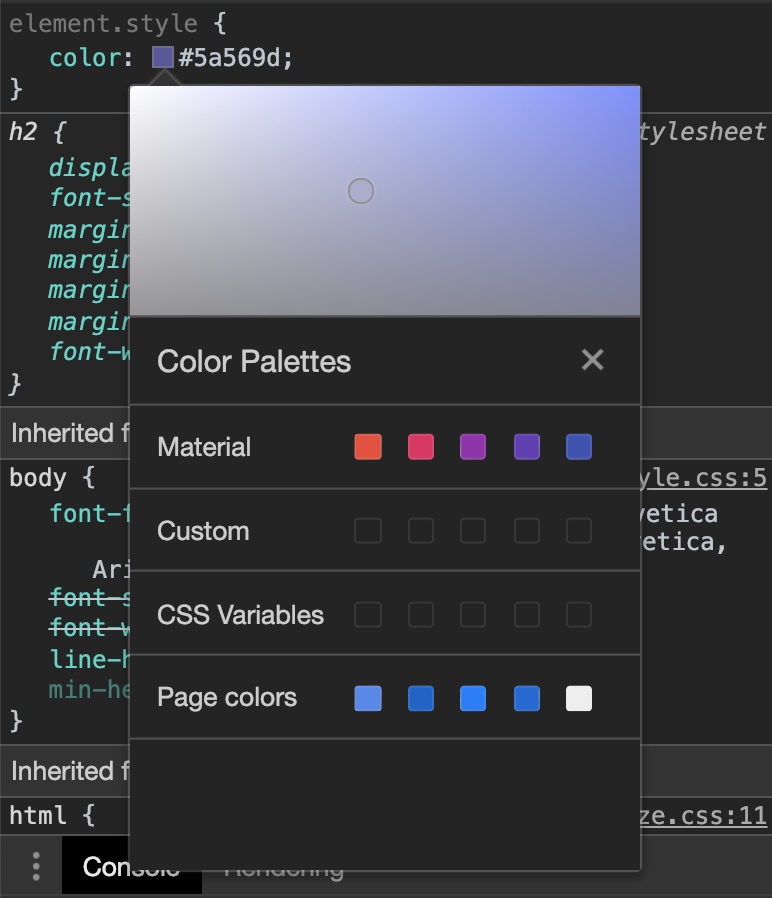
Material: Material Design 配色方案
Page colors: 页面中使用到的颜色
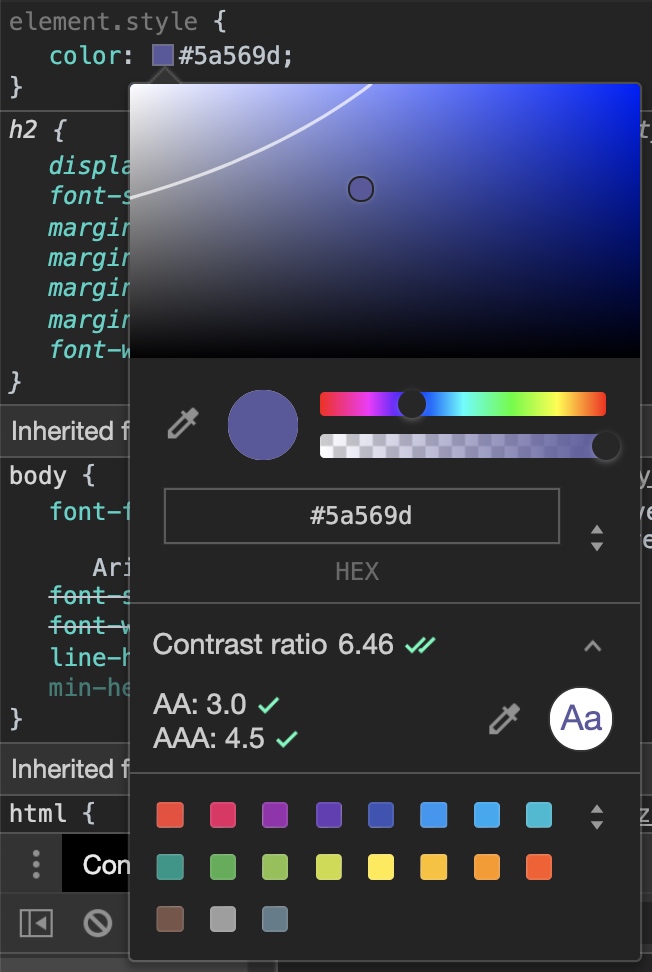
对比度建议
DOM 元素
展开子元素
按住 alt 键点击 DOM 元素可展开元素下的所有子元素。
编辑、拖拽
切换元素的隐藏、显示状态
选中元素,按 H 键可切换元素的隐藏和显示状态(相当于visibility: hidden)
DOM 断点
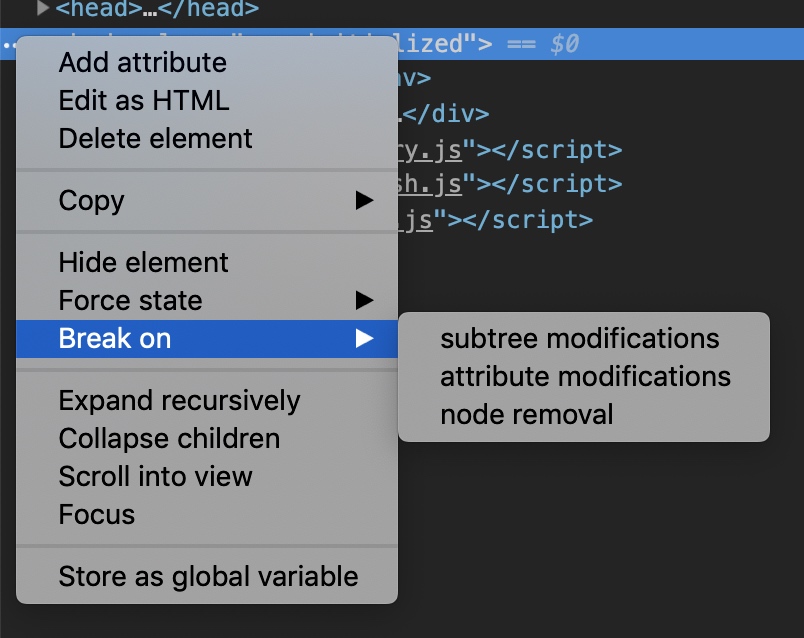
点击 DOM 元素前的 ···,可以选择对该元素进行断点调试。
以上三种断点方式分别对应:子节点变化、节点属性变化、节点移除的情况。
Style
computed
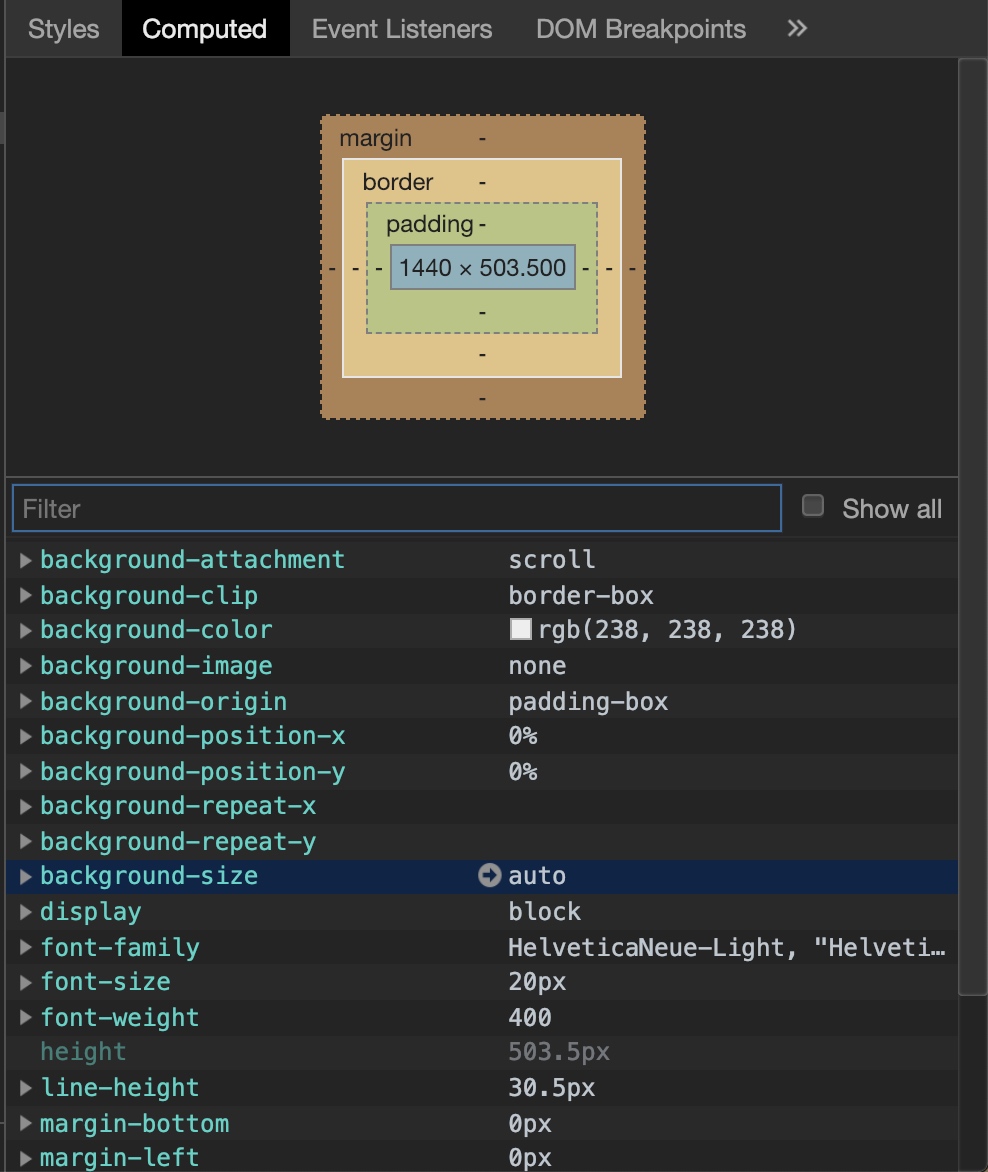
computed 中展示的是实际上生效的 CSS 样式,在相对比较大型的项目中比较有用处。
点击箭头可跳转到相应的 CSS。
Console
能够执行任何 JavaScript 语言,输出日志及报错信息。
支持 jQuery 语法。
Source
调试
watch
可以在 watch 栏中输入任何你想监听的变量。
scope
查看当前作用域里的所有变量。
call stack
可以看到执行到当前函数的详细调用栈。
XHR/fetch Breakpoints
在请求网络时断点调试。
也可以进行设置,在请求特定的 URL 时才设置断点: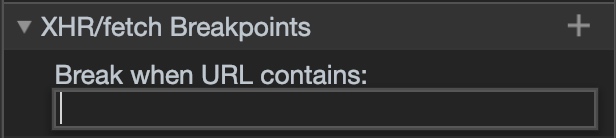
条件断点
可以设置当满足所设定的判断逻辑时才设置断点: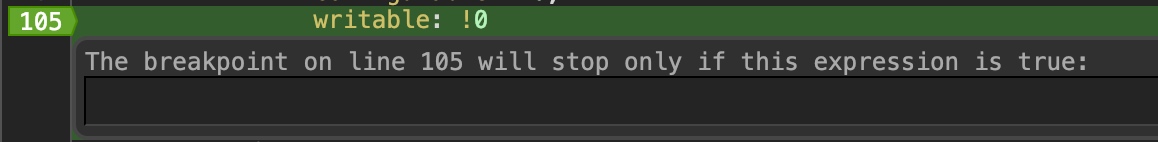
Network
查看请求关系
按住 shift 再将光标移动到请求文件上: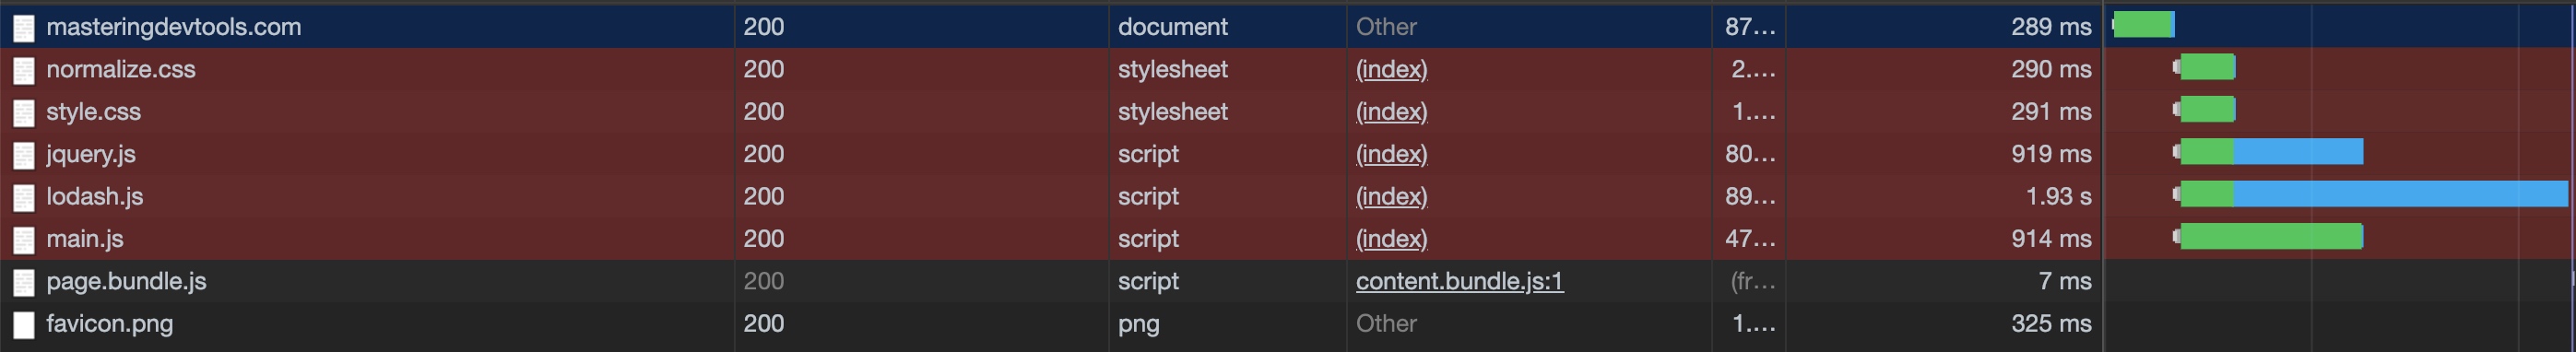
红色表示该文件发送的请求。
Resource Timing
点击 Timing 标签可以查看单个资源请求生命周期的精细分解。
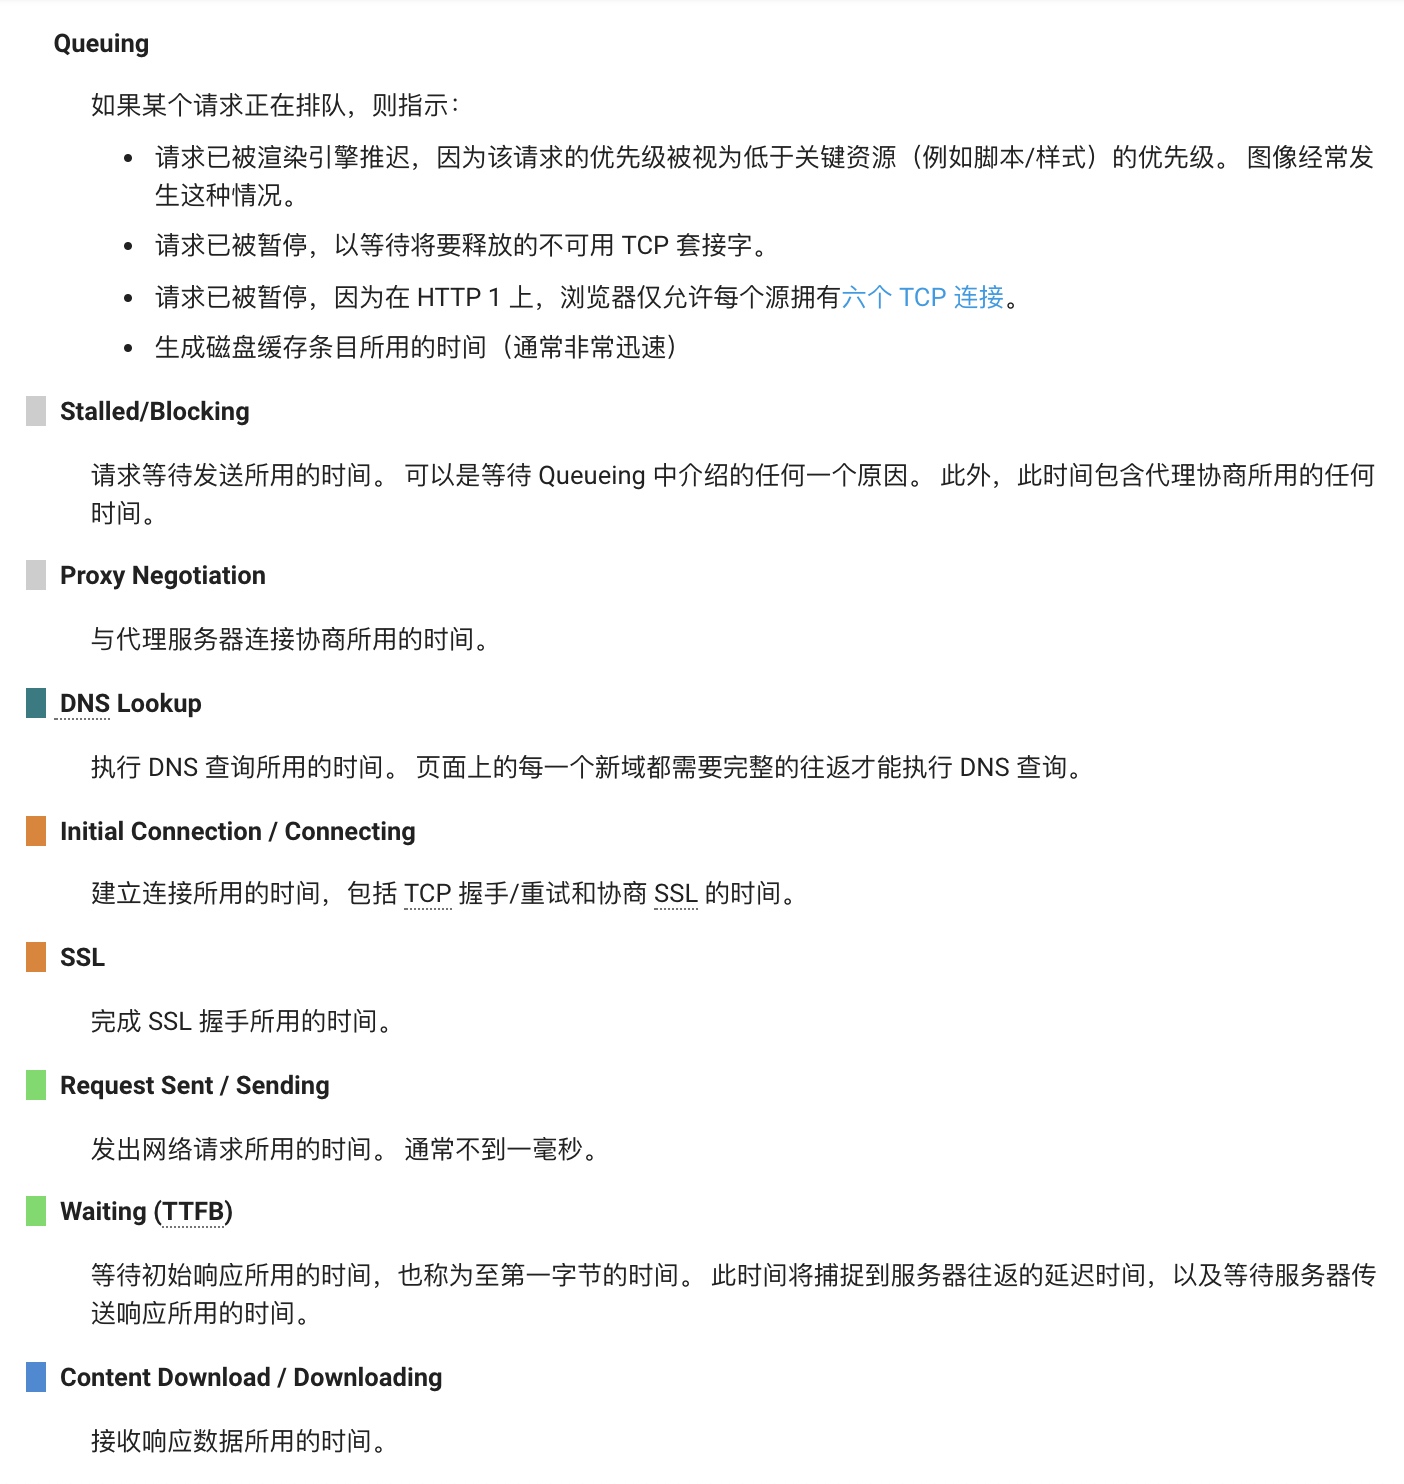
相关链接:Resource Timing
网络问题分析
Audits
Audits 面板基于 Lighthouse,提供了一套全面的测试来评估网页的质量。
Lighthouse 从 4 个方面来分析页面:Performance、PWA、Accessibility、Best Practice。
Performance Monitoring
The performance API
Performance 接口可以获取到当前页面中与性能相关的信息
例如计算耗时
石器时代的方法:
1 | const start = new Date().getTime(); |
现代的方法:
1 | performance.mark('start'); |
此外,你还能在 performance tab 页中看到相关信息。
Image Performance
1 | <img src="large.jpg" /> |
srcset 属性
1 | <img |
根据窗口的大小来动态请求响应的资源,做到资源的合理利用。
Memory
Common Causes of JavaScript Memory Leaks
- The Accidental Global
- The Forgotten Timer
- The DOM and not the DOM
1 | const button = document.getElementById('button'); |
判断内存泄漏
Chrome Task Manager Snapshots
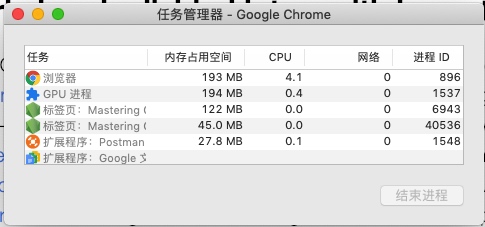
随着时间推移,内存占用空间不断地增加,则可判断为内存泄漏 。